Purple Extreme indicator
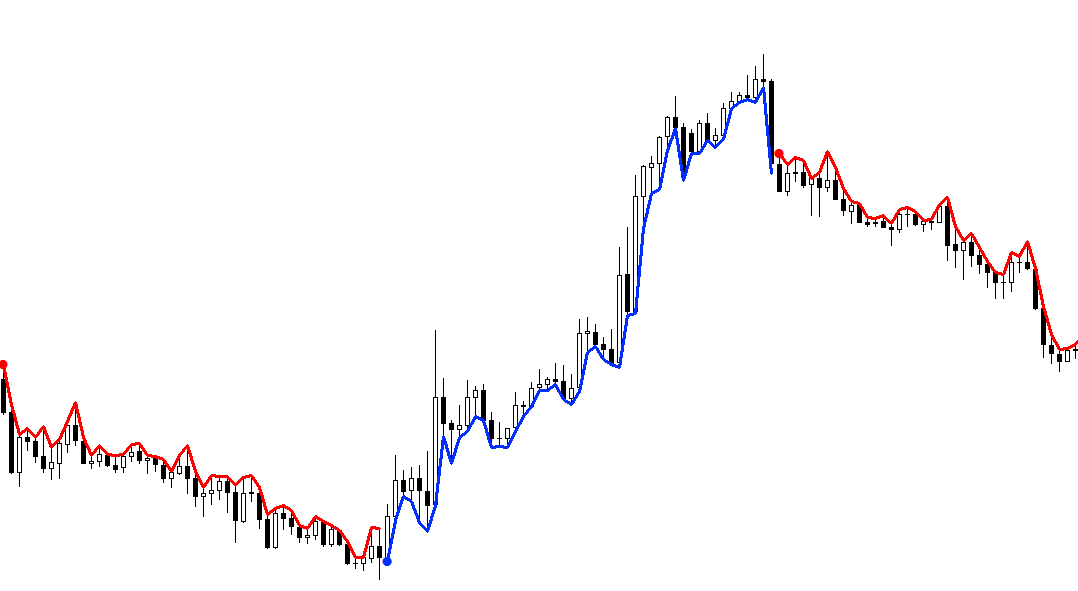
Get the Purple Extreme indicator for free, looking for extreme situations in the market in a form of oversold or, conversely, overbought market. The indicator itself is very easy to understand and intuitive for the users. Thanks to the Purple Extreme indicator, you will gain an overview about the fact when the market price reached its peak or conversely, its bottom.
A situation, when the buying side prevails (price of the underlying asset is strengthening markedly), occurs in financial markets frequently. Or, conversely, the sellers’ side may prevail (price of the underlying asset is falling markedly) as well. Nevertheless, usually such situation does not last for long as sooner or later, the strength of any of these sides is lost and the price of an underlying asset comes back to normal. Exactly these moments are those ones our special Purple Extreme indicator is trying to detect and allow you to utilize them within trading for your own benefit.
The use of Purple Extreme indicator within trading
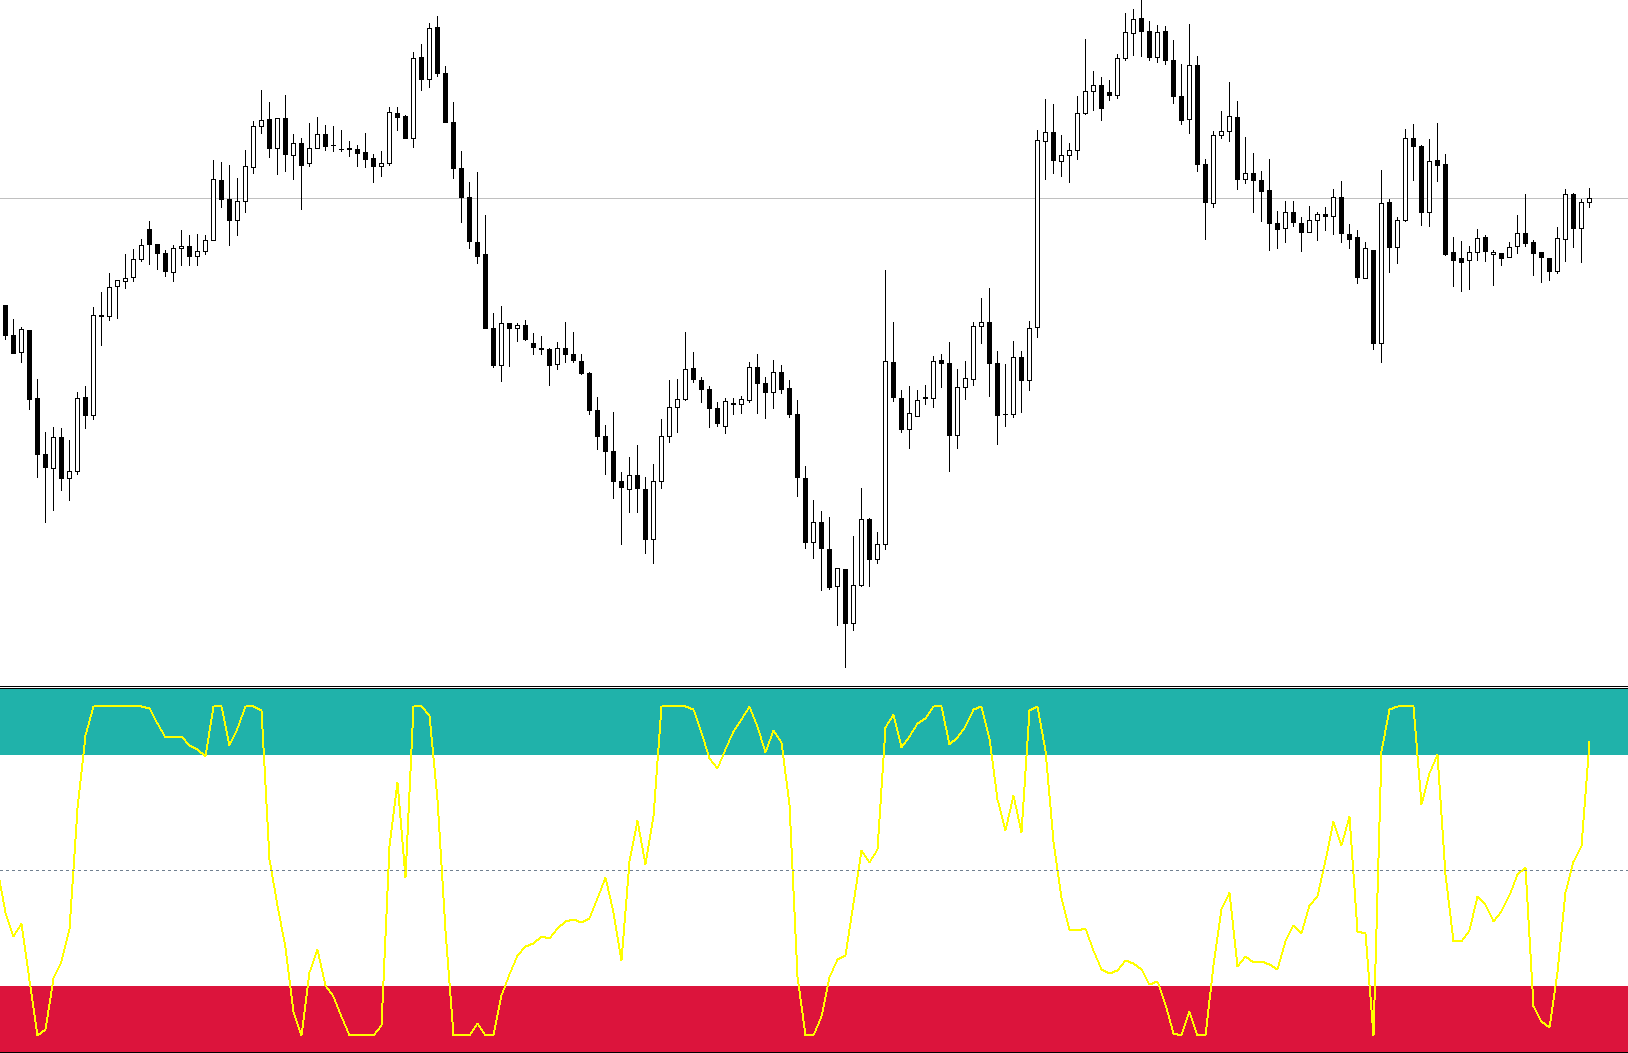
- This indicator consists of three different parts.
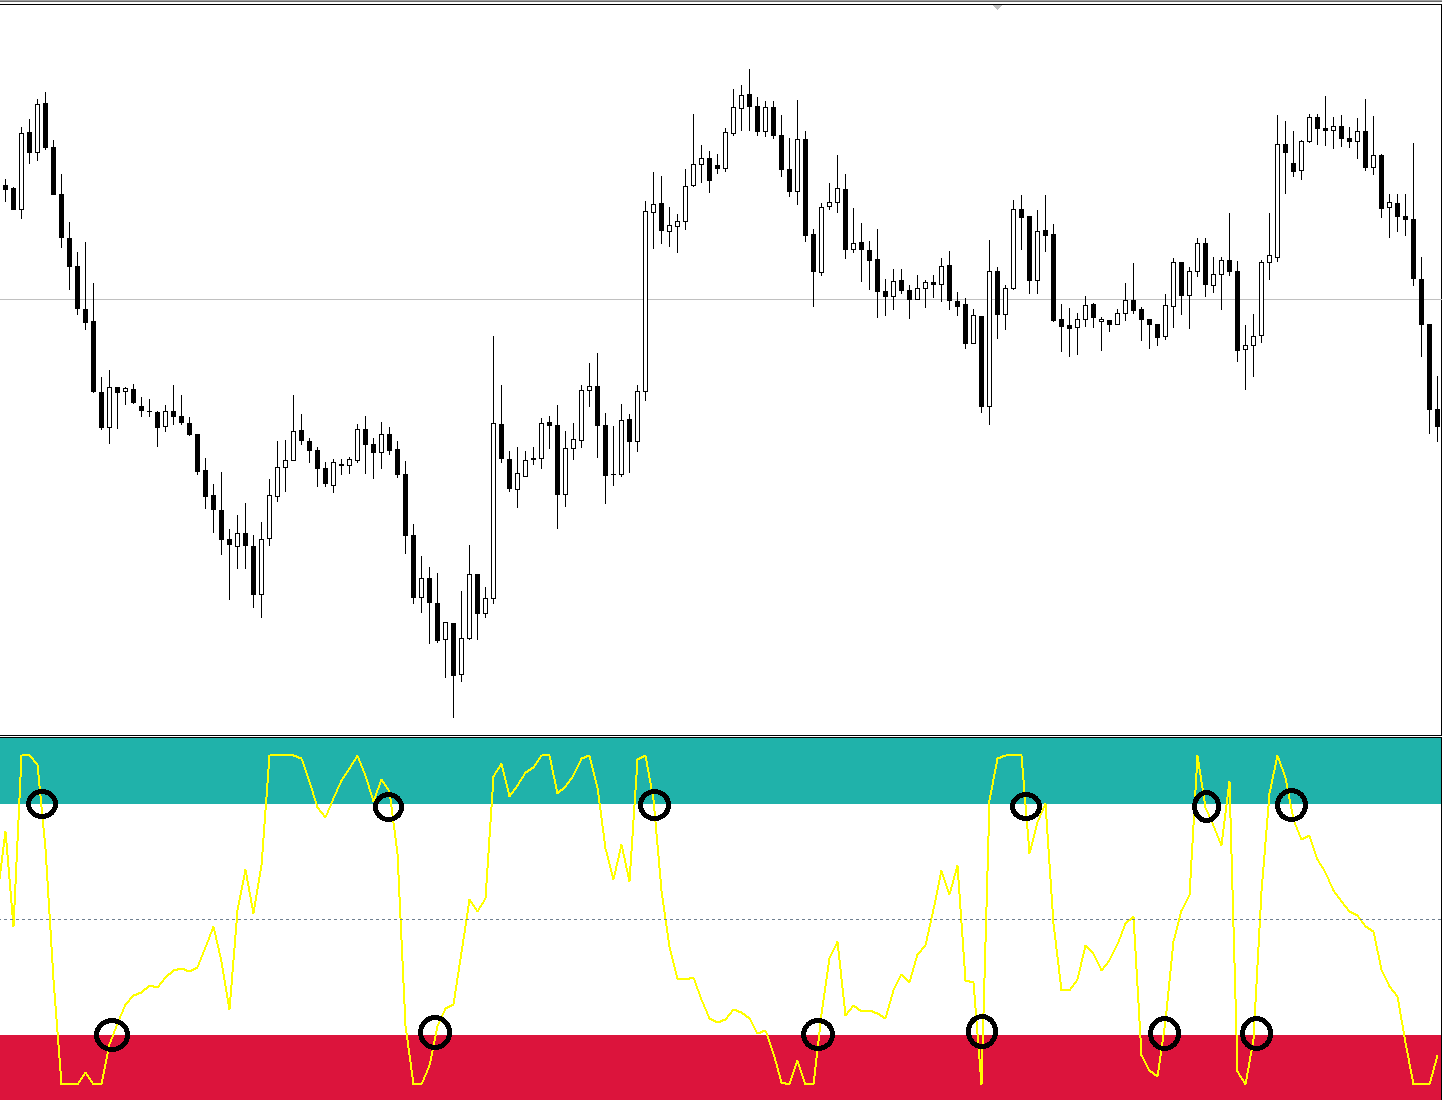
- If the yellow line comes into the blue-green part of the indicator, there’s a strong increasing trend in the market. At the same time, it could point to a potential turnover in the trend, so initiating a decreasing trend. However, such situation does not have to occur immediately. It’s always better to wait for confirmation if the yellow line leaves the overbought blue-green part and starts to go downwards. In such case, you may consider opening of a trade.
- White part of the indicator points to a neutral zone when the buyers and sellers are almost equal. Then, the zero, intermittent line shows the break-even point when the buyers are in advantage (white part above from the zero line) or the sellers (white part below the zero line). Any breaking through a zero line may be used, theoretically, as a signal for entering or leaving the trade in an alternative use of an indicator or as an additional filter for another indicator.
- If the yellow line remains in the red part of the indicator, there’s a falling trend in the market. At the same time, it may point to a turnover in the trend, so marking an initiation of a rising trend. However, such situation does not have to occur immediately. It’s always better to wait for confirmation when the yellow line leaves the overbought red part and starts to point downwards. In such case, it’s possible to consider a trade opening.
- Please, note that Purple Extreme indicator experiences mistakes from time to time as well. Leaving the extreme zone (blue-green and red) with a yellow line does not have to mean a change in trend definitely!
This indicator can only be used in our “Purple Trading MT4” trading platform.
How to start the Purple Extreme indicator:
- Run your Purple Trading MT4 trading platform
- Click of the “File” above on the left and select the possibility “Open data folder”
- Open the “MQL4” folder and then the “Indicators” folder
- Place the downloaded file (indicator) into the “Indicators” folder
- Turn off and on our Purple Trading MT4 trading platform
- Now, you have your Purple Extreme indicator prepared for use
Be where "human to human" approach is a reality
Your Capital is at Risk.
Professional client's account

Something extra
Purple Strike indicator. Download our unique indicator for free!